Introduction:
Having recently explored how Council spend on property construction related services has evolved in recent years, we are now also able to examine Oxygen’s Insights Spend system in greater depth to determine how Council expenditure has evolved on services related to property consultancy, and to find out which types of Councils saw their net share of expenditures increase and decrease over the last few financial years.
During the 2019/20 financial year, Local Authorities collectively spent £698.70M on property consultancy related services, which represented a decrease of 1.7% in comparison to the previous year. In 2020/21, spending was higher at £899.71M, up 28.76% over last year, and early indicators suggest that spending will rise even more in 2021/22 and may eclipse the £1bn mark.
Council Expenditure for 2019/20:
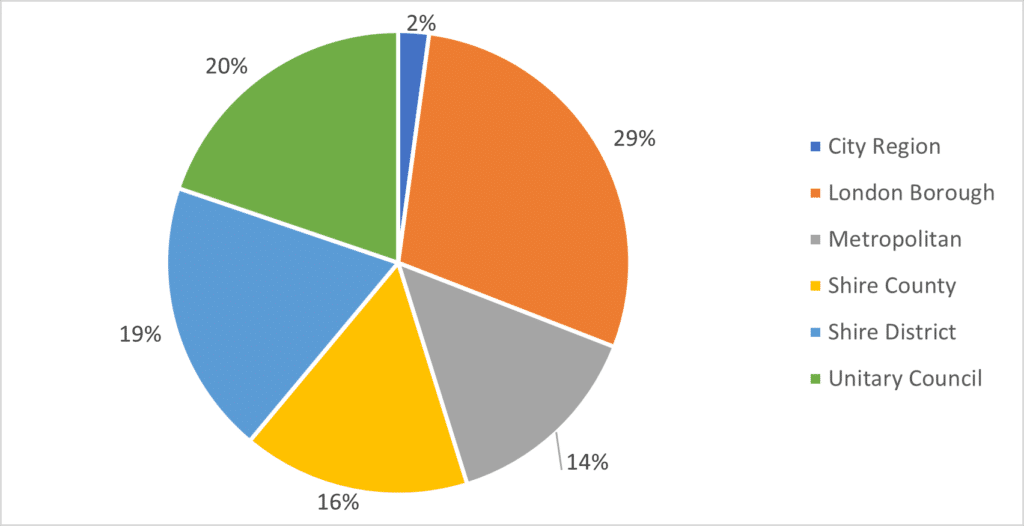
In the chart below, we show how the total expenditure was divided among the six groups of Local Authorities in 2019/20, clearly indicating that a significant proportion of it was spent by London Boroughs and Unitary Councils, who combined accounted for £339.22M.
In addition, when comparing the total expenditure by London Boroughs and Metropolitan Councils, which was £99.79M for the latter, Insights Spend reports that each Metropolitan Council spent an average of £2.77M on property consultancy services, while the average per London Borough was £6.28M. The three biggest London Borough spenders for 2019/20 were Camden, the Corporation of London, and Westminster City Council, who contributed £76.05M collectively.
Net-Spend Difference:
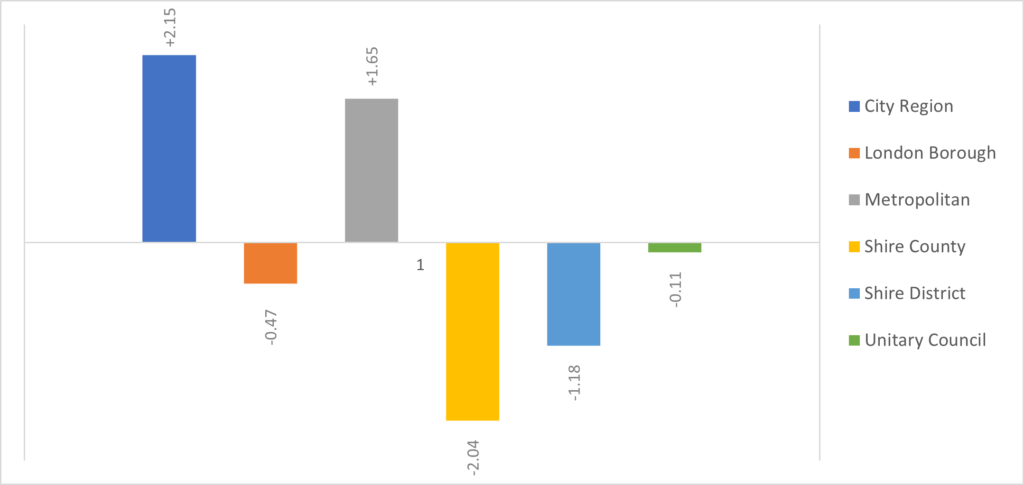
Despite Council spending increasing by nearly 29% to £899.71M in 2020/21, a number of groups saw their net spending decrease between the two years. Most notably, Shire Counties only collectively spent an additional £13.5M on property consultancy services for 2020/21, in a year when total spending across local government increased by just over £200M. Nonetheless, Insights Spend data shows that four of the top five Shire County spenders for 2019/20 increased their total spending in 2020/21, with Gloucestershire and Kent County Councils most notably increasing their total spending by 58.77% and 92% respectively in comparison to the previous year.
On the contrary, Metropolitan spending grew by approximately £44M between the two years, and represented one of the largest net spending increases among the six groups. In 2020/21, the average spend per Metropolitan had risen from £2.77M to £3.98M, with Birmingham City Council, Manchester City Council, and Knowsley Council making up the top three spenders and accounting for £61.9M of total spending.
Further Information:
Oxygen’s Insights Spend provides a real-time market overview of public sector/supplier spend, facilitating advanced procurement decision making.