The Current Housing Crisis in the UK:
A report recently published by the Building Back Britain Commission (BBBC) outlines that up to 140,000 new homes will be needed “per annum over the next 20 years” to keep pace with the rising demand for affordable housing in the UK, and that government needs to step up its efforts regarding ‘levelling up’ by “putting housing at the heart of those plans” and addressing how demand is calculated across different parts of the UK (p.4).
Most notably, the report indicates that “most pressure for new housing is in the southern regions, with many local authorities in these areas failing to meet their housing targets”, and that up to an additional 67,000 new homes will be needed per year on top of the current estimates put forward by the government to deal with the current housing delivery shortages (p.5).
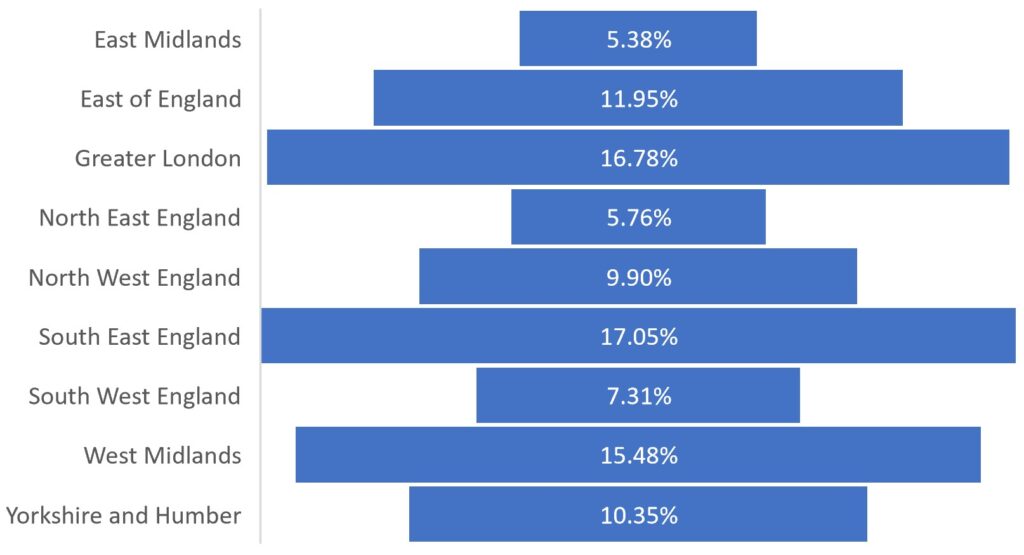
Through utilising Oxygen’s Insights Spend system, we can examine Council spend on property construction-related services, which includes the construction of affordable housing, and highlight specifically how spending has varied across the nine regions in England. Overall, the 2020/21 Financial Year saw local authorities spend just over £2.91bn on property construction related services – with Greater London and South East England each contributing roughly 17%. The total spend for Greater London in 2020/21 reached £489.91M, which is over £320M more than that recorded for North East England, where the total spend accounted for 5.76% as illustrated in the chart below:
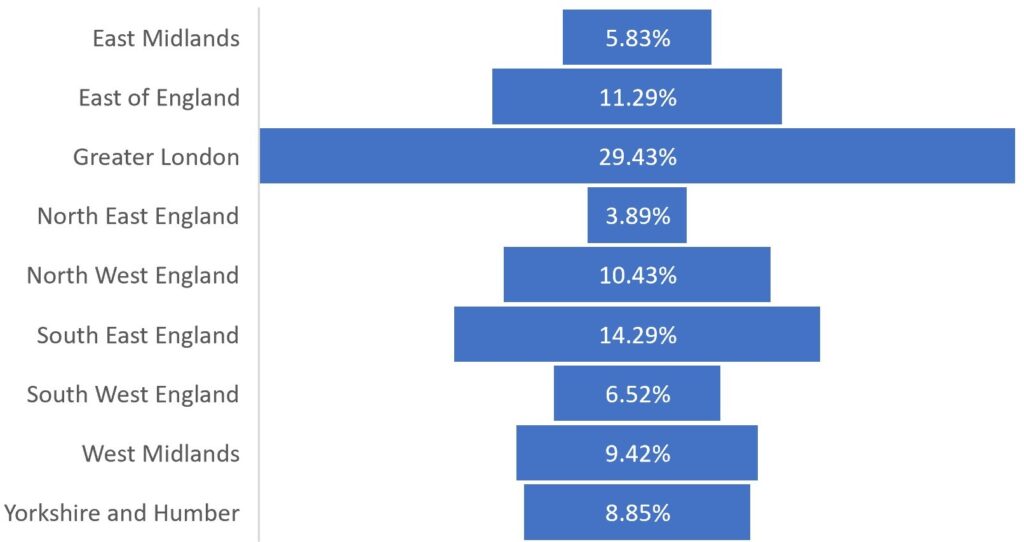
Regional Spend for 2017/18:
Notably however, while total spend for 2020/21 reached almost £3bn, this figure only represents an increase of just over 3.3% on the levels seen in 2017/18 – a period during which wider Council spend across all markets has increased by over 17%. Furthermore, from a regional perspective, the distribution of spending across the nine regions looked considerably different back in 2017/18. For instance, the Greater London region accounted for roughly 30% of total spend across all nine regions, and the North East England region accounted for even less than it did for 2020/21, at only 3.89%:
Evolution of Regional Spend:
The distribution of Council spend on property construction services has changed considerably in the last three years, previously only Greater London as a region made up more than 15% – whereas fast forward to the most recent full financial year, and three regions now make up greater than 15%. The Insights Spend data also indicates that the level of spending in some of the southern regions is distinctively lower than others, which might help explain why some of the local authorities in the southern regions are struggling to meet their housing targets. The South West region for example is ranked as the 7th lowest region for spend across both charts, and has seen its net-spend increase by a marginal 0.79% in comparison to the other regions over the last three years.
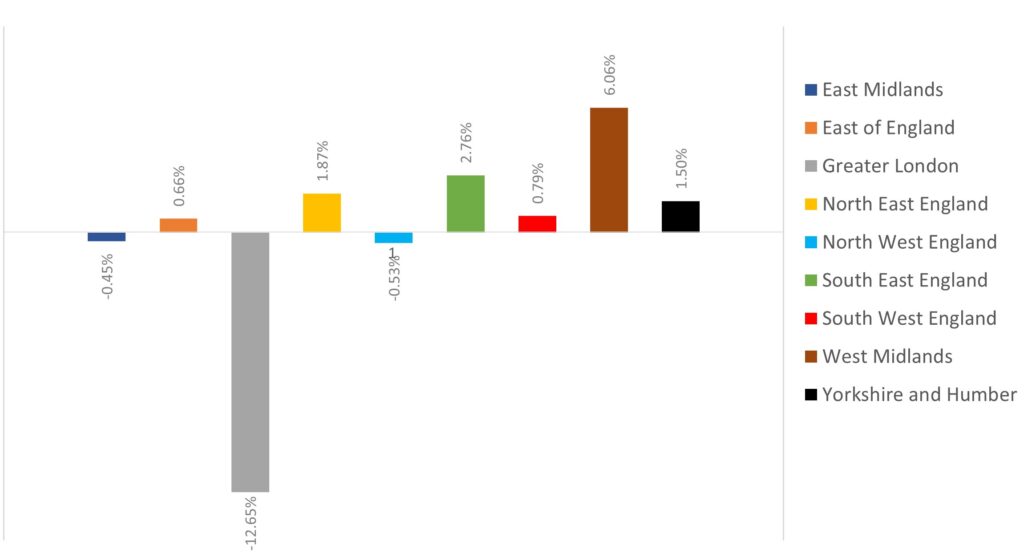
To conclude, we can also see how spend has differed across the regions over the last three years using Insights Spend’s data. For example, the chart below clearly shows that regions such as the West Midlands and South East England have seen significant increases in comparison to Greater London, which has seen its net spend reduce by over 12%:
Further information:
Oxygen’s Insights Spend provides a real-time market overview of public sector/supplier spend, facilitating advanced procurement decision making and helping suppliers understand their buyers better.